Analytics Dashboard
As executive dashboard allows you to visually analyse lots of data in a single page. It enables you to track and share KPIs (key performance indicators) with your team for in depth data analysis and collaboration.
With CLIDE Analytics, you can create insightful executive dashboards in minutes.

Track key performance indicators. Empower your business.
Create KPI dashboards
quick and easy.
Visualise and analyse your data with dashboards. Create insightful KPI dashboards to track your key performance indicators. With our KPI dashboard tool, share the business dashboards you create with your colleagues for easier data analysis and collaboration.
Get actionable insight from your data with CLIDE Analytics
Transform data into
insights and actions in minutes
Turn raw data into insightful reports and dashboards . Track your key business metrics, see longtime trends, identify outliers and predict the future.
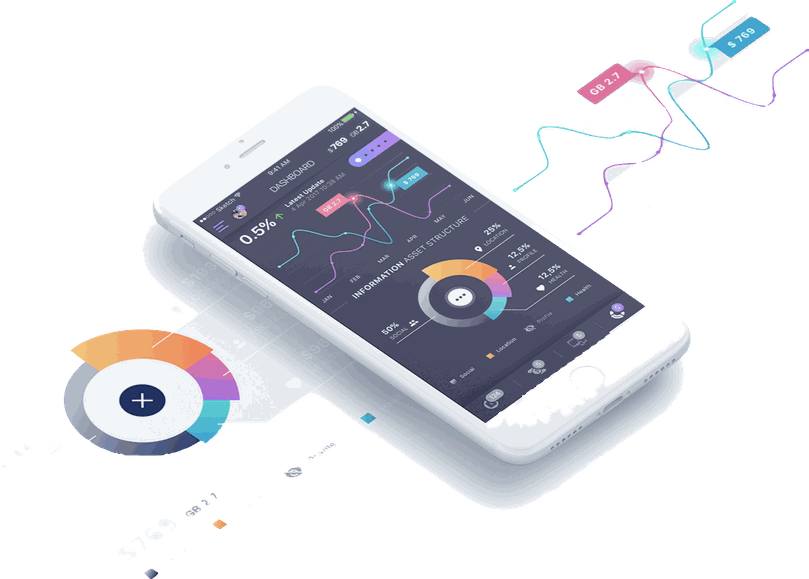
Analytics on the move
Interact with your data, reports and dashboards anytime, anywhere, from your mobile devices.
Learn more about - Mobile BI App
Modern Powerful Analytics Platform
Connect, prepare and analyse your data, create stunning data visualisations, and discover hidden insights, all within minutes.
Data Storytelling
Tell engrossing stories with your data. Present/publish analytical insights in the context of familiar business workflows. Make analytics a joy!
Visual Analysis
CLIDE Analytics Visualisation Options